Why CEOs Should Judge Marketing by Cost Per Signed Job, Not Cost Per Lead
Cost per lead tells a CEO how cheaply an ad produces an inquiry. Cost per acquisition, measured here as cost per signed job, tells the CEO what it costs to win a customer. In one Southern California painting company’s 2026 ad results, the two measures pointed in opposite directions: the channel with the cheapest leads was not the one that made the most money.
Key takeaways
- Cost per lead measures the price of an inquiry. Cost per signed job measures the price of a customer, and only that number connects ad spend to revenue.
- In the painting company’s data, Facebook and Instagram leads cost $104 each against $229 for Google Local Services Ads, yet a signed job cost $3,541 on Facebook and Instagram and $1,319 on Local Services Ads.
- Measured by closed revenue per ad dollar, Local Services Ads returned 11.0x, the other two channels about 2.8x, and all three combined about 4.1x.
- Judge a channel over a quarter rather than a month, fix source tracking before trusting any report, and remember that closed revenue is not profit.
What is the difference between cost per lead and cost per acquisition?
Cost per lead is ad spend divided by the number of inquiries. Cost per acquisition is ad spend divided by the number of customers won. In a business where the average job is about $13,000, as it is at the painting company in this report, a lead is a name and a phone number, while a job is a signed contract.
A CEO who reads only cost per lead rewards whichever channel sends the most inquiries for the least money. A CEO who reads cost per signed job rewards the channel that turns inquiries into paid work. The two numbers can disagree sharply, and the painting company’s results show how.
What did one Southern California painting company’s ad results show?
Rob Pene, founder of Mission Driven Brand in Torrance, California, published the ad results of a family-owned residential painting company in Southern California. The data covers January 1 to August 24, 2026, across three paid channels, and the firm’s full case study has the channel-by-channel detail. The company is not named here.
| Channel | Spend | Leads | Cost per lead | Jobs | Cost per job | Closed revenue | Return |
|---|---|---|---|---|---|---|---|
| Google Local Services Ads | $10,548 | 46 | $229 | 8 | $1,319 | $116,257 | 11.0x |
| Facebook and Instagram | $17,707 | 170 | $104 | 5 | $3,541 | $50,255 | 2.8x |
| Yelp Ads (estimated) | $37,053 | ~70 | ~$529 | ~9 | ~$4,260 | ~$103,765 | ~2.8x |
| All three | $65,309 | ~286 | ~$228 | ~22 | ~$3,010 | ~$270,277 | 4.1x |
Figures marked with a tilde are estimates. The Yelp numbers were estimated from the mix of paid and free leads Yelp reported, of which 51 percent were paid. The return column is closed job revenue divided by ad spend.
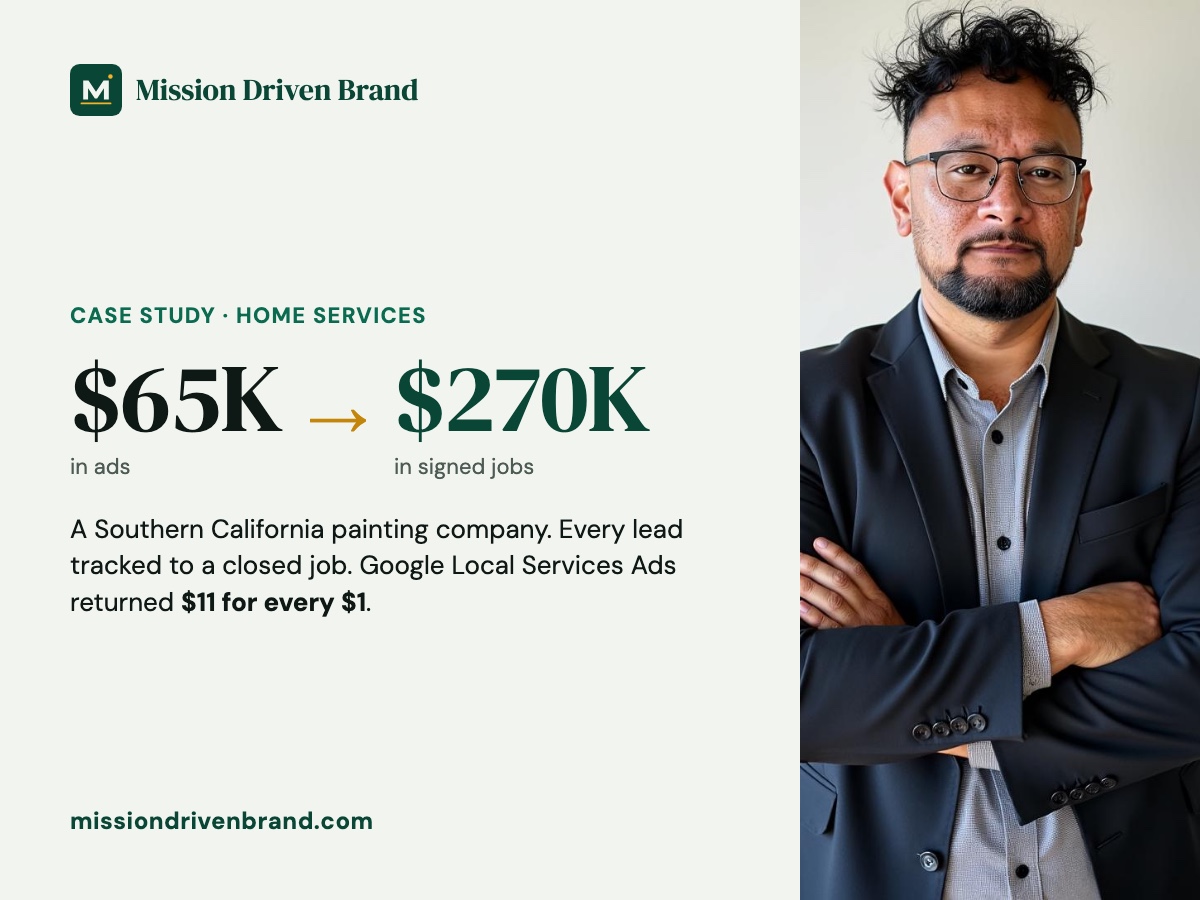
Across all three channels, the company spent $65,309 and closed about $270,277 in revenue. That is a blended return of about 4.1x, but the average hides a wide spread. One channel returned 11.0x while the other two returned about 2.8x.
Why did the cheapest leads produce the weakest results?
Facebook and Instagram delivered the cheapest leads of the three channels at $104 each, and also the weakest conversion. Only 29 percent of those leads booked an estimate, and 10 percent of the estimates closed. The five resulting jobs cost $3,541 apiece, about 2.7 times what a job cost through Local Services Ads.
Local Services Ads leads cost more than twice as much, at $229. They were also far more likely to become customers: 63 percent booked an estimate, and 28 percent of those estimates closed. Eight jobs came from 46 leads.
The company acted on the difference. Facebook and Instagram spend fell from about $3,400 a month in the first quarter to about $1,200 by summer.
Yelp complicates the picture in a useful way. It had the highest share of leads that booked an estimate, at 71 percent, yet it also had the highest cost per lead and the highest cost per job. A high booking rate does not guarantee a low cost per signed job when the leads themselves are expensive.
Why should CEOs judge ad channels over a quarter instead of a month?
Because large jobs do not close on the calendar of a monthly report. Local Services Ads, the best performer in the data, produced two months with zero closed jobs. Then $37,000 in work closed in July.
A CEO reading a single month in isolation would have cut the winning channel during its slow stretch. Over a longer window, the same channel returned 11.0x. The practical rule is to set a review period that matches the sales cycle, and for work in the five-figure range that means looking at a quarter at a minimum.
How do you measure marketing ROI for a local business?
Start by tracking where every lead came from. Follow each lead to a closed job. Then divide the closed revenue by the spend on that channel. Each step can fail quietly, and the painting company’s records show one way.
Thirty-nine customers had been logged in the company’s customer database as plain “Google” when they had actually come from Local Services Ads. Until that was corrected, the best channel was undercounted and the source label was misleading. Cleaning up the source field was a precondition for any trustworthy comparison.
The report also carries two honest limits. The revenue figure is closed job revenue, not profit, so it says nothing about what the company kept after materials and labor. And customers who arrived through organic search, referrals, repeat business or yard signs were not counted at all, even though they made up most of the company’s revenue. The numbers describe paid advertising, not the whole business.
The same principle showed up in a separate engagement. An education company Pene worked with grew its monthly ad budget from $5,000 to $50,000 and still earned about $4 for every $1 spent, because every dollar was tied to a sale.